|
Economic Freedom Improves Human Well-Being |
|
by Yanick Labrie & Bradley Doucet |
|
When it comes to economic freedom, the numbers tell a very consistent story, although it is a story that remains underappreciated to this day. Indeed, in the years since the financial crisis of 2008, the free market has taken a beating in the marketplace of ideas. Yet the simple fact remains that the more economic freedom a government leaves in the hands of its people, the better off those people are, not only in terms of basic material well-being, but also in terms of social and individual indicators of human well-being—things like health, education and happiness. This is true whether we compare different countries and regions with each other, or whether we compare them across time.
This Economic Note provides a brief overview of economic freedom around the globe. It then looks at some of the numbers that demonstrate the strong, positive effects of allowing people greater freedom to interact among themselves in the market.
The State of Economic Freedom
There are two annual publications that track the state of economic freedom around the world: the Fraser Institute’s Economic Freedom of the World (EFW) report(1) and the Heritage Foundation’s Index of Economic Freedom (IEF).(2) While admittedly not a simple and straightforward calculation, both publications measure, in slightly different ways, the size of countries’ governments and the scope of government intervention in various aspects of the economy. The cornerstones of economic freedom as defined by the EFW report are 1) personal choice, 2) voluntary exchange coordinated by markets, 3) freedom to enter and compete in markets and 4) protection of persons and their property from aggression.(3)
From a planetary perspective, the news is good. The average economic freedom score as measured by the EFW report has grown from 5.32 out of 10 in 1980 to 5.78 in 1990, to 6.72 in 2000, and finally to 6.84 in 2012.(4) The IEF shows a similar pattern, with its average global score rising from 57.6 out of 100 in its 1995 edition to a high of 60.4 in its 2015 edition.(5)
 As for the best and worst countries, the latest editions of the two reports include the usual suspects: Hong Kong and Singapore take top honours, while places like North Korea, Venezuela, Zimbabwe and Cuba bring up the rear. Canada ranks among the top 10 on both indices: 6th place in the IEF and 7th in the EFW. This is notably higher than the United States, which ranks 12th on both indices.(6) As for the best and worst countries, the latest editions of the two reports include the usual suspects: Hong Kong and Singapore take top honours, while places like North Korea, Venezuela, Zimbabwe and Cuba bring up the rear. Canada ranks among the top 10 on both indices: 6th place in the IEF and 7th in the EFW. This is notably higher than the United States, which ranks 12th on both indices.(6)
Indeed, both reports have noted the declining scores of our allegedly freedom-obsessed neighbour to the south over the past decade. What is to blame for the regression of the United States? The reports identify such factors as rapidly expanding debt, intrusive regulations, greater use of eminent domain, the betrayal of bondholders’ property rights in the auto-bailout case, and the growth of non-tariff trade barriers and foreign investment restrictions.(7)
Basic Material Well-Being
Economic freedom makes people wealthier. As it has expanded over the past two decades, with the world becoming “moderately free” overall, real global GDP has risen by approximately 70%. Meanwhile, the proportion of the global population living in poverty has been cut in half.(8) This means that literally hundreds of millions of people have climbed out of poverty over the past twenty years, thanks at least in part to growing economic freedom.
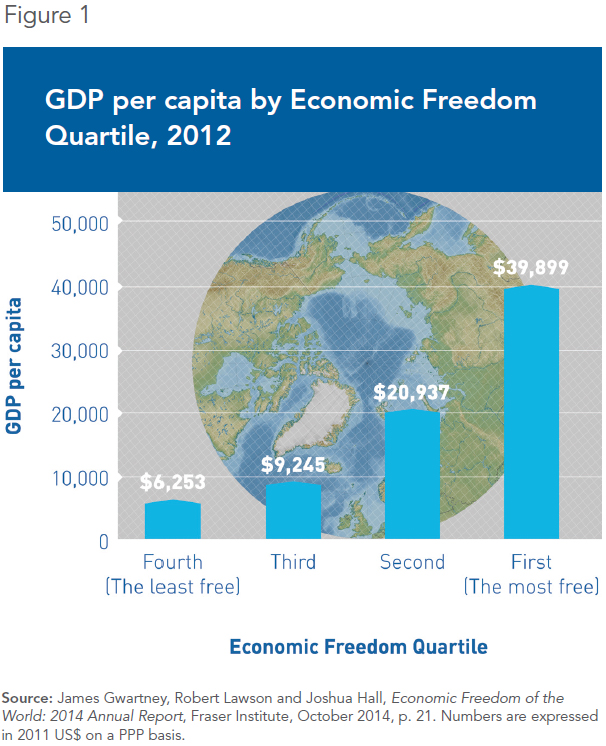
Comparing countries, it is clear that individuals living in places with more economic freedom tend to have substantially higher average incomes. The most economically free 25% of nations had an average per capita GDP of $39,899 in 2012, compared to $20,937 for the second freest quartile, $9,245 for the third freest quartile, and $6,253 for nations in the bottom quartile(9) (see Figure 1).
Countries with more economic freedom also tend to enjoy more rapid economic growth. From freest to least free quartile, over the past two decades, the economies of the world have grown by a very respectable annual rate of 3.69%, a not bad 3.15%, a slightly slower 2.81% and a very slow 1.09%. To put this in perspective, an economy growing at an annual rate of 3.69% will double in size in less than 20 years, compared to almost 64 years for an economy growing only 1.09% per year.(10)
|
|
“The countries around the world that best promote human well-being are, generally speaking, those where the crucial importance of economic freedom was starting to be understood and appreciated two and three hundred years ago.” |
|
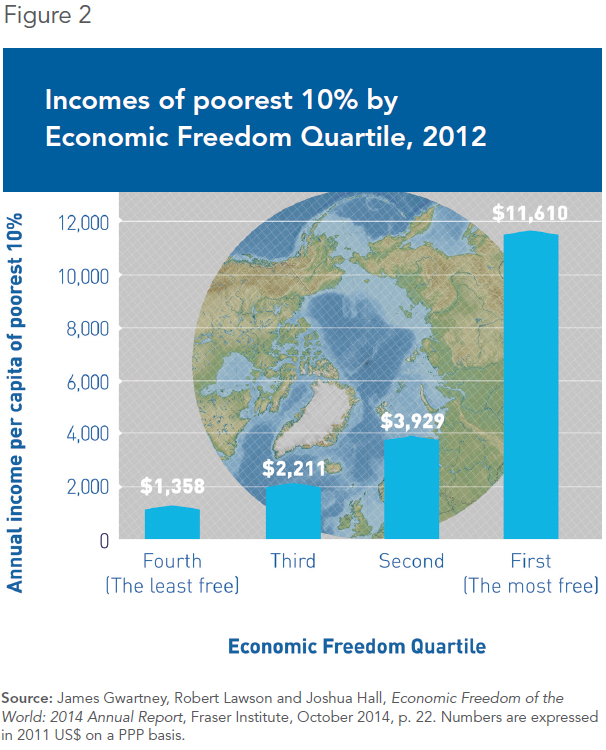
As for poverty, the share of income earned by the poorest 10% of a country’s population is uncorrelated with economic freedom. The poorest 10% earn around 2.5% of GDP regardless of how free a country is.(11) Of course, given the strong positive correlation between economic freedom and per capita GDP discussed above, the poorest 10% who live in the freest countries are much better off in absolute terms. They enjoy average incomes of $11,610, compared to $3,929 for countries in the second freest quartile, $2,211 for the third freest and a mere $1,358 for the least free quartile(12) (see Figure 2). Clearly, the poor living in a country with a decent amount of economic freedom are better off than those living in a country that is less free.
It is impossible to talk about changes in the global poverty landscape without at least mentioning that China and India, the two most populous nations on Earth, have been growing a lot less poor. Although they remain relatively unfree, with neither of them breaking into the top 100 on either index, they have become considerably freer than they used to be, especially in terms of trade freedom. China’s EFW score climbed from a dismal 3.74 in 1980 to a much better 6.20 in 2012, while India’s score rose from 4.50 in 1975 to 6.65 in 2012.(13) It would be hard to overstate the importance of the changes that have occurred in these two countries, allowing a staggering number of people to live substantially better lives than their parents did.
 Social and Individual Indicators of Human Well-Being Social and Individual Indicators of Human Well-Being
Beyond the basic material comforts that come with high and rapidly growing per capita incomes, there are other, social indicators like health and education that are very important to human well-being. The available data show that these, too, are positively correlated with economic freedom. This should hardly be surprising given the correlations discussed in the previous section, since among the things that money can buy are hospitals and schools.
Life expectancy is the most basic overall measure of health, and as expected, it has grown as the world has become freer and richer. According to the World Health Organization, global life expectancy at birth was 70 years in 2012, a six-year increase since 1990.(14) Comparing nations, individuals born today in the most economically free 25% of countries in the world can expect to live on average 79.9 years, or 16.7 years longer than those born in the least free quartile.(15)
Education is another important social indicator of human well-being. The United Nations Human Development Index combines measures of educational attainment, life expectancy and income into a composite value.(16) As the world has become freer, this measure of human development has also progressed, from 0.56 out of 1 in 1980 to 0.70 in 2013, a substantial improvement.(17)
Between countries, economic freedom is strongly correlated with Human Development Index values. Those countries with IEF scores higher than 80 had a very high average Human Development Index value of 0.91 in 2012. As for those countries with IEF scores lower than 60, their average Human Development Index value was just 0.56.(18)
In addition to being wealthier, healthier and more educated, the data tell us that individuals who live in countries with more economic freedom are also happier. Those born in countries scoring higher than 7.5 out of 10 in the EFW report have an average life-satisfaction score of 7.64, whereas those scoring lower than 6 in that report have an average life-satisfaction score of 5.85.(19)
This might simply be due to the high correlation between EFW scores and GDP per capita. After all, money may not buy happiness outright, but it is reasonable to expect it to have some influence on life satisfaction.(20) Indeed, per capita GDP does have a considerable impact on life satisfaction.(21) But even after controlling for income levels and other socio-economic variables, positive effects on life satisfaction remain.(22) It seems that people value freedom not only because it makes them richer, but also because it makes them free.
Conclusion
 The countries around the world that best promote human well-being are, generally speaking, those where the crucial importance of economic freedom was starting to be understood and appreciated two and three hundred years ago. There are also a few notable exceptions that have caught on (and caught up) more recently—like Hong Kong, where the enthusiastic embrace of free trade, non-interventionism, budgetary discipline, a flat personal income tax of 15% and a flexible labour market led to a ninefold increase in real GDP per capita over the past five decades.(23) The countries around the world that best promote human well-being are, generally speaking, those where the crucial importance of economic freedom was starting to be understood and appreciated two and three hundred years ago. There are also a few notable exceptions that have caught on (and caught up) more recently—like Hong Kong, where the enthusiastic embrace of free trade, non-interventionism, budgetary discipline, a flat personal income tax of 15% and a flexible labour market led to a ninefold increase in real GDP per capita over the past five decades.(23)
But there is still room for improvement, even in the freest countries. We would all be wealthier, healthier, more educated and happier if the governments of industrialized and industrializing nations alike were to take heed of the data, and move more quickly and consistently in the direction of greater economic freedom.
|
1. James Gwartney, Robert Lawson and Joshua Hall, Economic Freedom of the World: 2014 Annual Report, Fraser Institute, October 2014.
2. Terry Miller and Anthony B. Kim, 2015 Index of Economic Freedom, The Heritage Foundation and Dow Jones & Company, Inc., January 2015.
3. James Gwartney, Robert Lawson and Joshua Hall, op. cit., footnote 1, p. 1. The IEF, for its part, emphasizes three fundamental principles of economic freedom that touch on similar themes: empowerment of the individual, non-discrimination, and open competition. Terry Miller and Anthony B. Kim, op. cit., footnote 2, p. 11. 4. James Gwartney, Robert Lawson and Joshua Hall, op. cit., footnote 1, p. 15.
5. Terry Miller and Anthony B. Kim, op. cit., footnote 2, p. 70.
6. Ibid., pp. 4-9; James Gwartney, Robert Lawson and Joshua Hall, op. cit., footnote 1, p. 8.
7. Terry Miller, Anthony B. Kim and Kim R. Holmes, 2014 Index of Economic Freedom, The Heritage Foundation and Dow Jones & Company, Inc., January 2014, pp. 31-32; James Gwartney, Robert Lawson and Joshua Hall, op. cit., footnote 1, p. 15.
8. Terry Miller, Anthony B. Kim and Kim R. Holmes, ibid., p. 50. Real global GDP in 2005 US dollars rose from $31.7 trillion in 1993 to $53.7 trillion in 2012, an increase of 69.4%. The percentage of the global population living in poverty fell from 43% in 1990 to 21% in 2010.
9. James Gwartney, Robert Lawson and Joshua Hall, op. cit., footnote 1, p. 21. Figures in 2011 US dollars at purchasing power parity (PPP).
10. James Gwartney, Robert Lawson and Joshua Hall, Economic Freedom of the World: 2013 Annual Report, Fraser Institute, September 2013, p. 22. Average annual percentages are from 1991 to 2011. (Calculation of doubling times: log 2 / log 1.0369 = 19.13 years, and log 2 / log 1.0109 = 63.94 years.)
11. James Gwartney, Robert Lawson and Joshua Hall, op. cit., footnote 1, p. 22. From freest to least free by quartile: 2.78%, 2.23%, 2.41% and 2.48%.
12. Ibid., p. 22.
13. Ibid., pp. 16-17.
14. World Health Organization, Global Health Observatory, Life expectancy.
15. James Gwartney, Robert Lawson and Joshua Hall, op. cit., footnote 1, p. 23.
16. The education component of this value is based on measures of average actual years of schooling for 25-year-olds and expected years of schooling for children of school-entering age.
17. Khalid Malik, 2014 Human Development Report, Sustaining Human Progress: Reducing Vulnerabilities and Building Resilience, United Nations Development Programme, 2014, p. 167.
18. Terry Miller, Anthony B. Kim and Kim R. Holmes, op. cit., footnote 7, p. 26.
19. James Gwartney, Robert Lawson and Joshua Hall, op. cit., footnote 10, p. 224, Figure 4.4.
20. Betsey Stevenson and Justin Wolfers, “Subjective Well-Being and Income: Is There Any Evidence of Satiation?” American Economic Review: Papers & Proceedings, Vol. 103, No. 3, May 2013, pp. 598–604.
21. James Gwartney, Robert Lawson and Joshua Hall, op. cit., footnote 10, p. 223.
22. Ibid., p. 230.
23. Jean-François Minardi, “Hong Kong: The Ongoing Economic Miracle,” Economic Note, Montreal Economic Institute, November 2013. |
|
|
More by
Bradley Doucet |
|
▪
Fifty Shades of Statism
(no
329 – February 15, 2015)
▪
Freedom Encourages Goodwill to All
(no
327 – December 15, 2014)
▪
Just Cause, or Just 'Cause?
(no
325 – October 15, 2014)
▪
The Great Fact: A Review of Deirdre McCloskey's
Bourgeois Dignity
(no
324 – Sept. 15, 2014)
▪
The Police State Needed to Enforce Vice Laws
(no
323 – June 15, 2014)
▪
More...
|
 |
|
First written appearance of the
word 'liberty,' circa 2300 B.C. |
|
Le Québécois Libre
Promoting individual liberty, free markets and voluntary
cooperation since 1998.
|
|