|
Quebec, a Typical Low-Growth High-Income Region |
|
In the opinion of many Quebecers, the so-called "Quiet Revolution"
associated with various reforms implemented by the provincial government
in the 1960s is viewed as progress and as the advent of a system of
thought liberated from religious enslavement. In short, as access to
modernity. We submit an alternative interpretation.
State Control
It can be argued that Quebec society in the 1960s freed itself from a
certain fundamentalist religious enslavement. On the other hand, it
became enslaved by an ideology as powerful as (if not more so) the
belief that characterized its traditional faith. This enslavement is
called statism or state control.
Such ideological evolution is not exclusive to Quebec, of course. Canada
as a whole has moved to a system of welfare entitlements from cradle to
grave. Relative to the US, it has become more unionized; more protected
from foreign competition; its businesses are more subsidized; and Canada
is more heavily taxed (38.4% of GDP as opposed to 32.0% in the US in
2011).(1)
The result is the loss of a chunk of individual liberty. The movement
toward a more public system has simply been more pronounced in Quebec
than in the rest of the country and of North America in general. In
fact, Quebec has copied the European model.
The facts are indisputable. Modes of intervention which impact on
relative prices have exploded since the 1960s: subsidies, taxes, customs
tariffs, quotas, nationalizations, public corporations, preferential
purchases, social regulations, and prohibitions. While the share of the
Quebec public sector was lower than in other provinces in the 1950s, it
accelerated in the 1960s to account for a greater part of the economy
than the rest of Canada. These conditions continued afterwards and are
still observed today. While the share of public spending in the overall
Quebec economy was some 4% below the Canadian average in 1961, it had
moved up to more than 4 percentage points above by 1978.(2)
 In 2009, Quebec’s share had reached 47.3% versus 38.4% in Canada as a whole, almost 9 percentage points higher.(3)
Quebec's civil service employs the same number of people as
California’s.(4)
It should be noted that the separatist movement is itself a side product
of this faith in the power of the state to do good. Separatism, which
developed in the 1960s, is an aspiration mostly promoted by leftist
intellectuals who associate progress and modernity with state planning. In 2009, Quebec’s share had reached 47.3% versus 38.4% in Canada as a whole, almost 9 percentage points higher.(3)
Quebec's civil service employs the same number of people as
California’s.(4)
It should be noted that the separatist movement is itself a side product
of this faith in the power of the state to do good. Separatism, which
developed in the 1960s, is an aspiration mostly promoted by leftist
intellectuals who associate progress and modernity with state planning.
How to interpret this evolution is a difficult question, but drawing on
the economic theory of information in an economy where two languages are
spoken, it can be shown that the Canadian labour market was, and still
is, segmented by the cost of information. The small-economy position of
the French-speaking segment leads to nationalism for some and to a
search for greater integration for others.(5)
A more radical interpretation of this evolution views the phenomenon as
derived from its non-British origin;(6)
a Fraser Institute study ranks the ten most free economies as
British-derived,(7)
with the exceptions of Switzerland and Estonia.
I also take it for granted that in the history of mankind, freedom has
been the exception. Prior to the Industrial Revolution, the average
human lived on between one and three dollars a day. But from that point
on, for the first time in human history, per capita income in a few
European countries and particularly in the USA began to grow rapidly.
This was the result of economic freedom, which enables entrepreneurs and
small businesses to flourish. The free-market system proved to be the
greatest engine for prosperity and opportunity. Doubt about the
effectiveness of policy is of course rejected by advocates of state
planning. At the same time, this belief in government is far from the
demonic perception of the free market by "warmists," who often claim
that endorsement of free-market economics implies rejection of climate
science.
As far as the distribution of income is concerned, the political left in
Quebec (and to a lesser extent elsewhere) counts on the hand of
government to move people up the economic ladder. In fact, this never
works, despite its good intentions. Conservatives and libertarians by
contrast understand from experience that the only way to help people
climb the economic ladder is to provide them the opportunity to pull
themselves up one rung at a time. Studies consistently confirm that
countries with higher levels of mobility and economic freedom have
poverty levels as much as 75 percent lower than countries that are less
free. Quebec and continental Europe show that more government is not the
way to do this. Both have had higher levels of public spending than the
United States, and both have had lower GDPs per capita.
First Consequence: Lower Quebec Economic Growth
As usually follows from a well-established rule, the consequences of
public budget inflation proved to be disastrous.
Figure 1 shows changes in Quebec’s share of
the total Canadian population since 1921. It can be seen that this share
remained constant at 29% from 1941 to 1966, but showed a declining
tendency thereafter, to stand at 23.1% in 2011. In 1981, the population
of Quebec was 74% that of Ontario, vs. 61% in 2011. Similarly, the
population of metropolitan Montreal represented 94% of Toronto’s in 1981
vs. 68% in 2011. Should the trend continue for the next half
century, Quebec would have a population of approximately the relative
size of British Colombia today.
Figure 1 - Quebec share of the Canadian population (1921-2011)
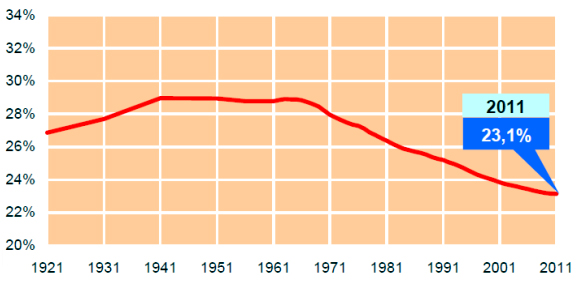
Source: www.stat.gouv.qc.ca,
January 13, 2012.
|
|
“In Quebec, a form of consensus on the state of the economy is by now
entrenched. In this view, not only is the province not losing ground, it
has improved its position relative to the rest of Canada and to Ontario
in the past few decades.” |
|
When measured in terms of overall economic growth, investment and
employment increase, the Quebec economy has witnessed a widening gap
with Ontario and the rest of Canada over the past decades. Considering
the period from 1981 to 2004, as studied by
Boyer,(8)
the following picture emerges. Real GDP growth averaged 2.4% in Quebec
versus 3.0% in the rest of Canada, for an overall gain of 70.9% in
Quebec and 96.3% in the rest of Canada. The Quebec share of national GDP
declined by 2.4 percentage points to 21.0% during the same period. From
1971 to 2004, Quebec’s working age (15 to 64) population rose by 33.9%,
compared to 70.9% in the rest of Canada. Over a shorter period from 1981
to 2004, employment gained 43.9% in the rest of Canada (38.7% in the
U.S.), but only 32.8% in Quebec. Also for the period 1981-2004, with
23.6% of the population in 2004, Quebec created only 19.7% of the new
jobs available in Canada. While only 56.2% of the Quebec population aged
15 and above was employed, the corresponding figures were 61.2% in the
rest of Canada and 61.9% in the U.S.
Second Consequence: Population Mobility
Observers often assume that overall GDP and per capita income move in
the same direction at regional levels as they do at the national level.
We argue below that interregional adjustments within a national,
integrated economy are realized, not through price or per capita income
differentials, but through people’s mobility. Quantities, not prices,
adjust, because prices are determined by outside forces. Slowly-growing
regions should therefore have as high per capita real income as
fast-growing ones, even though they grow at a lower rate.
Empirical validation:
The convergence of real per capita income has been documented in the
U.S., in the U.K., in France and in Canada. Between 1920 and 2000, per
capita income variations across the U.S. have significantly declined
with wide movements in populations. The share of population in the West
has almost tripled, while significant declines occurred in the Northeast
and the Midwest. Yet economists have shown that the distribution of per
capita income has narrowed over the century. At the end of the period,
real income dispersion per worker between the four big regions remained
extremely low. With a national average equal to 100, interregional
variations in 1980 ranged from 96 to 105.(9)
Interregional income differentials in England are on the whole tightly
distributed, once adjusted for cost of living differences.(10)
In general, rural areas show lower average income than London as
published in official statistics; yet equalisation is nonetheless
realised across both types of territory for similar occupations.
Analysts at the Institut national de la statistique et des études
économiques (INSEE) summarise their results on regional income in France
as follows: “Overall differences in price levels between the Paris
region and the rest of the country is of the same order of magnitude as
differentials in earnings levels.”(11)
In Canada, a federal budget indicates that “even though economic
disparities between provinces are still substantial, they have
nevertheless declined significantly over the past 25 years.”(12)
This reduced dispersion occurred as important movements of the Canadian
population took place: declining shares in the Atlantic Provinces and
Quebec together with rising shares in Ontario, Alberta and British
Columbia. As shown above, the Quebec share of the Canadian population
remained around 29% between 1941 and 1966, but after that period, it
showed a constant negative trend to reach 23.1% in 2011. Overall, our
data confirms that economic integration through trade, labour market
adjustments and migration lead to real personal income equalization, not
to price or income differentials.
Quebec, a Typical Slow-Growth High-Income Province
In Quebec, a form of consensus on the state of the economy is by now
entrenched. In this view, not only is the province not losing ground, it
has improved its position relative to the rest of Canada and to Ontario
in the past few decades.(13)
Because GDP per capita in Quebec has moved up nearer the level for
Ontario since the end of WWII, this result is interpreted as proof that
rising intervention by the Quebec government since the so-called "Quiet
Revolution" is behind the narrowing gap. What this actually shows is
that the indifference principle applies across regions and that
interregional adjustments are realised not by per capita income but by
migrations.
In terms of nominal GDP per capita, personal disposable income and
average weekly earnings, Quebec lags behind Ontario by 10% to 16%, but
those figures are not adjusted for differences in the cost of living
since no such provincial index is available. By the Consumer Price Index
for October 2006, the cost of living based on a basket of all goods and
services in Montreal was 14.7% below Toronto, while the housing cost
stood at 30 to 35% below Toronto. For its part, Human Resources and
Social Development Canada (2007: 78) in 2004 set the cost of an
identical basket of goods and services at 19.2% below its counterpart in
Toronto. Housing costs alone explained 90% of the gap, estimated at
$5,796 per year. Montrealers in general earn lower monetary incomes, but
these are wholly offset by lower land and local service prices. When
extended to the whole of Ontario and Quebec, this suggests that the
lower cost of land in Quebec almost perfectly compensates for the lower
GDP per capita. The divergence in total growth has been capitalized in
land prices.
What does not equalize across the economy is the price of the fixed
resource, land and physical structures. Quebec’s per capita income has
matched real income in Ontario in spite of its dismal growth and
therefore in spite of the “Quiet Revolution,” not because of it. As a
result of longstanding trade, the economies of the two provinces are
closely integrated. Labour market mobility and how immigrants choose
their location have resulted in real income levels being equalized
across the two provinces, despite the widening gap in total GDP.
We emphasize that these results are empirically validated in the US, the
UK, and France.
Conclusion
Quebec is a lagging province to the extent that its share of the
Canadian population, of GDP and of the labour force has declined since
the Quiet Revolution. The population’s movement and its corresponding
change in GDP indicate that in a provincial economy, integrated into a
national economy, adjustments are realized by quantities, not prices or
income per capita, except for the price of land and local services.
Because land is a resource in fixed supply, its price increases faster
in Ontario than in Quebec. The adjustment process continues until real
income per capita has equalized across the two provinces. The wide
divergence in total growth between Ontario and Quebec has been entirely
capitalized in the price of land and local services. Thanks to people's
mobility and lower growth of the Quebec population, Quebec residents
have participated in the rise in the Canadian standard of living. This
result entails a drawback however: To the extent that less mobile
Quebecers have not suffered from lower per capita income, they are less
likely to resist state control.
|
1. I have in mind here the
traditional United States, which has been the world leader in
the promotion of democracy and free markets. Its recent
evolution raises doubts on its example as the best practitioner
of these virtues.
2. Statistics Canada, Provincial Economic Accounts 1961-1976 and
Provincial
Economic Accounts 1963-1978, Ottawa, Ministère des
Approvisionnements et Services Canada, 1978 and 1981. A
more extensive study of Quebec economic history is available in
Vincent Geloso, Du Grand Rattrapage au Déclin Tranquille,
Les Éditions Accent Grave, 2013.
3. K Treff and D. Ort, Finances of the Nation 2011, Table B.8, p. B-14, Canadian
Tax Foundation 2012.
4. Mark Steyn, "Is
Canada's Economy a Model for America?" Imprimis, January
2008, Vol. 37, No. 1.
5. The idea that scale
economies of information are important in labour markets was
first suggested by Kenneth Arrow and presented as a problem of
external economies. Condensed in Jean-Luc Migué, "Economics and
the Problems of Minorities," in L.H. Officer and L.B. Smith
(ed.) Issues in Canadian Economics, McGraw Hill Ryerson
Ltd., 1974, pp. 258-274.
6. Mark Steyn, Op. cit.
7. Fraser
Institute, Economic Freedom of the
World, Annual Report 2007.
8. Boyer, M. (2006)
La performance économique du Québec :
constats et défis II, Montreal: Centre interuniversitaire de
recherche en analyse des organisations.
9. Mitchener,
K.J. and I.W. McLean (1999) "U.S. Regional Growth and
Convergence, 1880-1980," The Journal of Economic History,
No. 59, pp. 1016-1042.
10. D.B. Smith, Living with Leviathan, Hobart Paper 158, Institute
of Economic Affairs, London, 2006.
11. M.
Fesseau, V. Passeron et M. Vérone, “Les prix sont plus élevés en
Île-de-France qu’en province,” INSEE Première, No 1210, October
2008.
12. Department
of Finance (2006) Budget 2006. Restoring Fiscal Balance in
Canada: Focusing on Priorities, Ottawa, May 2,
p. 115.
13. Fortin, Pierre (2001) “ Has Quebec’s
Standard of Living Been Catching Up?” in P. Grady and A. Sharpe
(ed.), The State of Economics in Canada, Montreal:
McGill-Queen’s University Press, pp. 381-402.
|
|
|
From the same author |
|
▪
Equalization: A Program Without Foundation
(no
303 – Sept. 15, 2012)
▪
Les caisses d'épargne santé, un modèle pour survivre
à la médecine étatiste
(no
266 – 15 avril 2009)
▪
The Power of Liberalization in the Quebec Electricity
Regime
(no
264 – February 15, 2009)
▪
La course aux faveurs: un jeu à somme négative
(no
246 – 16 décembre 2007)
▪
Accommodements volontaires, plutôt que « raisonnables
»
(no
238 – 21 octobre 2007)
▪
More...
|
 |
|
First written appearance of the
word 'liberty,' circa 2300 B.C. |
|
Le Québécois Libre
Promoting individual liberty, free markets and voluntary
cooperation since 1998.
|
|