|
Will Interest Rates Remain Permanently Low? |
|
At extreme junctures the crowd is most prone to extrapolate the
unrepresentative present into the indefinite future. The result is that
the more intense is today’s craze, the more prominent are the intellects
that insist it’ll last. From this point of view, it’s hardly surprising
that the longer is the period of time during which rates of interest
fall and the lower the level to which they descend, the greater is the
number of people (particularly of influential and vocal people) who
believe – and the more fervent is their conviction – that rates will
certainly remain extremely low and probably fall even further.
I suspect that the conviction of today’s mainstream that “rates will
stay very low for very long” doesn’t just reflect their worship of
abstract models and fresh-and-blood central bankers, and their disregard
of the historical record: it belies their hubris that the future is
foreseeable and that our rulers, at least, can foresee it. I fear it’s
the old delusion (“it’s different this time”) in a new guise. When the
crowd celebrates the alleged exceptionalism of the times, it pays the
genuine investor to investigate contrary possibilities. Rather than
parrot the mantra that “rates will undoubtedly remain low,” it’s more
fruitful to consider the contrarian question: “what might happen when
they rise?”
Is it really different this time? The historical record demonstrates
convincingly that in one respect it undeniably is. Equally, there’s no
reason to think that it’ll remain so – and several to conclude that it
won’t. How to ascertain whether the present differs significantly from
the past? The most sensible way, it seems to me, is to analyse long
series of valid and reliable data. What’s the best way to consider
central banks’ discount rates and the yield of “risk-free” sovereign
debt? I believe it’s to put them into the longest possible context. What
institution provides this context? The Bank of England does.
Using data from the BOE’s web site, Figure 1 plots the BOE’s base rate
since October 1694 and the yield of HMG’s long-term bonds since June
1703. It’s analogous to the Fed’s discount rate; as such, it strongly
influences longer-term rates including mortgages, corporate bond rates
etc.
Figure 1
Bank of England’s Base Rate and HMG’s Long-Term Bond
Yields, October 1694-December 2014
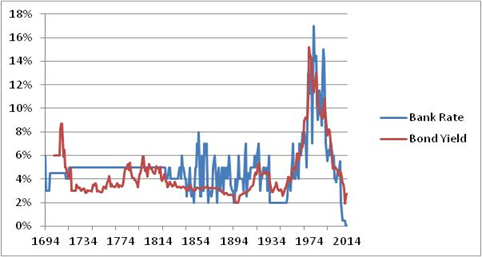
Two things in Figure 1 are clear: never has the Bank of England pushed
its base rate (1) remotely as low and (2) nearly as quickly as it began
to do late in 2008. In October of that year, the base rate was 5%; in
November, the Bank cut it to 3%; in December, to 2%; in February 2009,
to 1%; and in March 2009, to 0.5%. Within six months the Bank did
something that it had never done before: it slashed its base rate by 90%
(that is, (0.005 – 0.05) ÷ 0.05). Until February 2009, it had never set
it below 2%; since March 2009, it’s pinned it at a mere one-quarter of
that level. The period since early 2009 has no historical precedent; in
that sense, it is indeed fundamentally different this time.
Although the present is unprecedented, I suspect that the future (which,
alas, I can’t foresee) won’t be: that is, since June 1822 the base rate
has fluctuated erratically around its long-term mean – which from 1694
to October 2008 was 4.82%, and for the entire series (1694-2014) is
4.77%. What’s a “normal” base rate? Figure 2 provides a range of means
from which to choose. Whichever you prefer, the “normal” rate greatly
exceeds the average since 2009.
Figure 2
Bank of England, Average Base Rate during Various
Intervals, 1694-2014
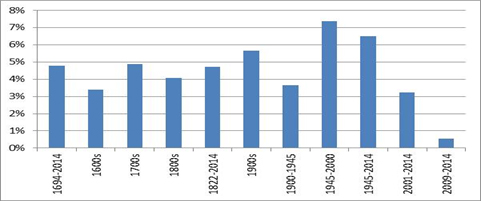
Sometimes the base rate soared far above its overall mean: in
particular, during most of the 1970s and 1980s it exceeded 12%. At other
times it sagged well below its mean: during the 75 years after 1835 it
averaged 3.7%, and during the 1930s and 1940s it averaged 2.3%. Notice,
however, that during these below-average periods both base rate and bond
yield frequently spiked well above their overall averages.
Slightly above-average and slightly below-average base rates have
prevailed for great lengths of time. Most notably, the rate remained
constant at 4.5% for 17 years (i.e., from June 1699 to June 1716) and at
5.0% for an astounding 103 years (i.e., from April 1719 to May 1822).
The bulls can indeed point to extremely long periods during which the
Bank of England never changed its bank rate. They can also cite extended
intervals of below-average rates.
Two inconvenient (for the bulls) facts remain. The first is important
enough to repeat: at no time has the base rate ever fallen as far and as
fast as it did in October 2008-March 2009. Second, at no time has it
remained as low as it has since March 2009. A slightly below-average
rate existed – albeit hardly continuously – for ca. three-quarters of a
century after 1835; but the record low which has prevailed since March
2009, or indeed anything like it, has never done so.
Hence our impudent question to today’s bulls: if since 1694 it’s never
been different (in the sense that you intend), then why – apart from the
lame reason that central banks must suppress their base rate in order to
support the bacchanalia – should anybody expect that the next 70 (or
even 20 or 10) years will be different from any other corresponding
period between 1694 and 2008?
Eschewing the bulls’ exuberance and bearing in mind that since 1822 the
Bank of England’s base rate hasn’t over time conformed to a rigid,
replicable and hence reliably and profitably predictable pattern, we can
express our scepticism more specifically. Figure 1 shows that the base
rate has tended, erratically but eventually, to regress from extremes
towards its overall mean. So too the long-term bond’s yield: lower
yields eventually follow above-average ones, and higher yields follow
below-average ones. If things aren’t, after all, different this time,
then it’s reasonable to expect that at some point – alas, neither I nor
you or anybody else knows when, but it’ll likely take us all by surprise
– not only will rates rise: they’ll also revisit their super long-term
average. When they do, I suspect that there will be hell to pay.
The Decrease of Rates Since the Late-1970s/Early-1980s
Why, generally speaking in most Western countries, have rates of
interest fallen almost continuously – and cumulatively massively – since
the 1980s?
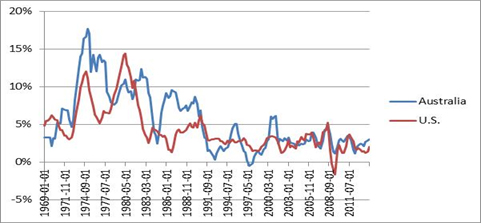
Figure 3 plots the yield of 10-year U.S. Government and Australian
Government bonds since July 1969 (when directly-comparable data became
available). Why 10-year securities? They’re a mid-point between the
longest-dated “risk-free” debt (the 30-year U.S. Treasury bond) and its
shortest-term counterpart (Treasury bills whose duration is one year or
less). And as we’ll shortly see, the 10-year has become the primary
means whereby the Treasury finances the U.S. Government’s deficit.
Figure 3
The Yield of Ten-Year Government Securities,
Australia and U.S., 1969-2014

Both series in Figure 3 tell much the same story: yields rose in the
1970s, peaked in the early 1980s and thereafter have fallen almost
continuously. In the U.S. since 1969, the ten-year yield has averaged
6.8% and in Australia it’s averaged 8.5%. Treasuries’ average yield
since 1969 has differed little from British gilts’ (which isn’t shown);
the average rate of ten-year Commonwealths, on the other hand, exceeds
the gilts’ and Treasury 10-years’ average.
The most significant (statistically, it explains more than one-third of
the total variation since 1969) proximate cause of changes of rates of
interest is the deceleration of the Consumer Price Index (CPI). Figure 4
plots the annualised increase of CPI in Australia and the U.S. since
1969. Like the 10-year yield, so too the CPI: it rose rapidly in the
1970s, peaked in the mid-1970s (Australia) and early-1980s (U.S.) and
thereafter has decelerated almost continuously. In the 1970s, CPI
averaged 6.9% in the U.S. and 9.2% in Australia; in the 1980s, it
averaged 5.6% in the U.S. and 8.4% in Australia; in the 1990s, it
averaged 3.0% in the U.S. and 2.5% in Australia; and since 2000 it has
averaged 2.4% in the U.S. and 3.0% in Australia.
Figure 4
CPI (Quarterly Observations), Australia and the
U.S., 1969-2014
Other things equal, an acceleration of CPI causes yields to rise and a
deceleration causes them to fall. Bonds’ yields rise in response to an
increase of CPI (more precisely, yields rise when lenders expect that
the cumulative CPI during the duration of their loan will accelerate)
because the increase of CPI erodes the future purchasing power of bonds’
principal and payments of interest. In the 1970s, as CPI accelerated,
long-term investors’ “real” (net of CPI) returns from 10-year Treasuries
fell. These and other investors began to expect that CPI would remain
high and rise higher. In order to protect themselves against this
erosion and to generate a positive rate of return, lenders demanded much
higher rates of interest; accordingly, Treasuries’ yields steadily rose.
In the early 1980s, investors feared that the rise of CPI might return
to the levels (above 10% per annum) it had scaled just a few years
before; accordingly, and in order to protect themselves against this
possible severe erosion of their purchasing power and to generate a
positive rate of return, they demanded compensating very high rates of
interest. Conversely, once CPI’s rise decelerated towards 3% per annum
and investors became convinced that it’d stay there, they became willing
to lend at far lower rates.
With that thought in mind, let’s consider matters as they stand today.
In the year to 30 September 2014, the yield of the 10-year U.S. Treasury
has averaged 2.53% and CPI has averaged 1.75%. Do you see the risk that
its purchasers face? Let’s assume (to the crowd it’s an article of
faith) that CPI accurately measures prices and their changes over time.
Also assume (I doubt it, but who knows?) that this rate of change of CPI
will remain constant during the next decade.
Given these assumptions, consider as an example the investor who
purchased a 10-year Treasury (again, for simplicity assume a purchase
price of $100) yielding 2.53% in 2014. After 10 years, if CPI increases
at a constant rate of 1.75%, in nominal terms the investor will receive
total payments of interest of $25.30; net of the effect of the very low
CPI, he’ll receive $22.97; and when Treasury redeems the bond in 2024,
he’ll receive principal whose nominal value will be $100 but whose
purchasing power is $83.80. After ten years under these circumstances,
the investment’s purchasing power increases from $100 in 2014 to $106.77
(i.e., $83.80 + $22.97) in 2024. That’s a “real” compound rate of return
of 0.66% per year.
Even given rosy (I’d call them “aggressively optimistic”) assumptions,
the real rate of return the investor can realistically expect is less
than 1% per year. Is that sufficient compensation for the risks he
takes? What if even slightly less optimistic conditions prevail? If, for
example, during the next decade CPI averages 2.4% (its average since
2000) the “real” rate of return decreases to -0.1% per year. Any average
rate of CPI greater than 2.4% per year generates increasingly bigger
losses. Under current circumstances, Treasuries don’t seem to offer
“risk-free” return; if anything (the phrase is James Grant’s), they
promise return-free risk! Who’d buy these securities under today’s
unappealing circumstances? In order to protect against the risk that an
unexpectedly high rate of increase of CPI erodes the purchasing power of
their capital, and to generate an acceptable “real” rate of return, I
suspect that at some point sooner than 10, 20 or 70 years lenders will
demand more adequate compensation. What if, for example, they demand a
rate of return (net of CPI) of 2% per year? Assuming that during the
next decade CPI rises 2.5% per year, purchasers of 10-year Treasuries
must demand a yield of 4.6% – which is much closer to its long-term
historical average, and almost double its average during 2014.
Why Has CPI Decelerated and Remained Stable?
Since the early 1980s, rates of interest have fallen primarily because
the CPI’s rate of increase has decelerated. Why has its rate of increase
slowed? Two sets of reasons: the first is largely market-based and
therefore beneficial, legitimate and maintainable; the second is wholly
non-market and hence harmful, illegitimate – and, I suspect, untenable.
-Three Largely Market-Based Reasons
Deng Xiaoping – China’s leader from 1978 until his retirement in 1992 –
symbolises the first reason. Of course, he didn’t single-handedly cause
the CPI’s rate of increase in Australia, the U.S. and elsewhere to slow.
Beginning in 1979, however, he commenced a series of economic reforms
which have expanded and accelerated over the years and whose cumulative
scope and consequences have no precedent. Hundreds of millions of
Chinese peasants began to manage and own the land they cultivated and to
sell their output on domestic markets. At the same time, China’s economy
quickly opened to foreign trade and investment. As a result, since the
late-1970s its imports of food have plummeted and its exports of ever
more advanced goods (produced by scores of millions of people who’ve
migrated from the countryside to rapidly-growing cities) have exploded.
Never before, surely, have so many risen so quickly from such abject
poverty.
China and other “emerging economies” have become the world’s biggest
producers and primary suppliers to Western nations of a vast number of
ever more advanced goods which Westerners were once the leading
producers. Not just because their labour has been quite inexpensive (but
progressively less cheap over time) by Western standards, but also
because their technology has usually approached and sometimes exceeded
Western standards, the emergence of China and other developing countries
as major forces in the international economy has increased the supply of
goods and services relative to the supply of money. Developing nations’
rise to prominence in a more integrated (“globalised”) world economy has
(and other things equal) caused CPI in Western countries to increase
less rapidly than it otherwise would.
|
|
“I suspect that the conviction of today’s mainstream that
‘rates will
stay very low for very long’ doesn’t just reflect their worship of
abstract models and fresh-and-blood central bankers, and their disregard
of the historical record: it belies their hubris that the future is
foreseeable and that our rulers, at least, can foresee it.” |
|
Bill Gates symbolises a second reason. Neither he nor Steve Jobs or any
other CEO single-handedly caused its rate of increase to slow. They do,
however, epitomise the IT revolution, dating roughly from the late
1970s, which has enhanced the productivity of production, transport,
marketing and distribution. Better IT enables a given amount of output
to occur at lower cost (or more output at the same cost). Other things
equal, these advances of productivity increase the supply of goods and
services relative to the supply of money, and thereby place downward
pressure upon the prices of goods and services. Nowhere has this
phenomenon been more apparent than in the computing and IT industries.
Sir Roger Douglas and Paul Keating (the Treasurer, not the PM) provide a
third reason. As much as anybody, and more than most, each promoted
reforms that commenced in all Anglo-American countries (but later and
much less thoroughly in Western Europe) in the late 1970s. These
reforms, which by the late 1980s had become near-orthodoxy, have
enhanced domestic competition for goods, services and labour. More
vigorous competition, in turn, has (again, other things equal) tended to
place downward pressure upon prices.
-Two Non-Market Reasons: Heavy Purchases by Foreigners and the Fed
How does the government affect rates of interest? Specifically, how does
its fiscal policy (namely the size of its budget’s deficit or surplus)
affect rates? “The conventional view,” say Douglas Elmendorf and Gregory
Mankiw (Government
Debt,
Federal Reserve Board, Finance and Economics Discussion Series,
1998-1999), “is held by most economists and almost all policymakers.
According to this view, the issuance of government debt … ‘crowds out’
capital and reduces national income in the long run.” Fifteen years
later, that remains the mainstream’s assessment. It’s not wrong: in
plain English, and assuming that the deficit is financed solely from
domestic savings and holding constant the policy of central banks (which
are vital caveats which we’ll revisit), the government finances a
deficit of (say) $1m by borrowing $1m – that is, by issuing to the
general public securities of whose total face value is $1m.
Private investors exchange this amount of cash, which the government
then spends, for the government’s newly-issued bills, bonds and notes.
The cash which private investors use to buy these debt securities
cannot, of course, simultaneously be put to other uses – such as the
purchase of private sector bonds, shares and other securities. The
government’s deficit thus reduces the total quantity of investable funds
but leaves unaffected private entities’ demand for these funds. The
greater is the size of the government’s deficit relative to the private
sector borrower’s demand for funds, the more the government’s demand for
finance “crowds out” the private sector’s.
Like a game of musical chairs in which the number of contestants exceeds
the number of chairs, the unchanged private demand for a diminished
(after the government’s issue of securities) supply of funds increases
competition for these funds. How do private borrowers ensure that
they’ll win a seat (i.e., obtain funds) before the music stops? They
offer more attractive terms and conditions – namely higher rates of
interest – to lenders. Unless domestic savers suddenly increase their
propensity to save, or the private sector’s demand for investable funds
subsequently decreases, or the government finds some alternate source of
finance, given the aforementioned assumptions a government which
consistently runs deficits will place upward pressure upon rates.
The phrases “America’s national debt” and “total face value of the U.S.
Treasury’s outstanding securities” are synonyms. Figure 5 stratifies the
U.S. Government’s debt obligations according to their duration: the
Treasury’s bills are short-term debt (repayable less than one year); its
notes are medium-term (repayable in 1-10 years); and its bonds are
long-term (payable in 11-30 years).
Figure 5
The U.S. Government’s Debt Obligations, Total and
Major Components ($US Trillion), 1969-2014
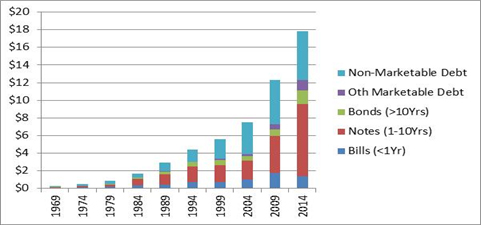
Debt has grown from $259 billion in 1969 to $17.829 trillion in
mid-2014. That’s a compound rate of growth of 9.9% per year. The size of
America’s economy, measured by Gross Domestic Product (GDP) in nominal
dollars, has increased from $1.02 trillion in 1969 to $16.77 trillion in
mid-2014. That’s a compound rate of growth of 6.7% per year. If only
parenthetically and rhetorically, it’s nevertheless worth asking:
whether for an individual, household, corporation or government, can
debt indefinitely grow more quickly than gross income (revenue)?
At first glance, the analysis to this point disconfirms the contention
that large and rising deficits place upward pressure upon interest
rates. Not only has the U.S. Government generated deficits virtually
without exception since 1969: its cumulative deficit – that is, the
national debt – has grown exponentially. Yet these large and rising
deficits clearly haven’t impeded the almost continuous decrease of rates
of interest since the early 1980s. Much lower rates have accompanied
far bigger deficits. How can this be? Recall the two assumptions: first,
domestic savings provide the sole source of deficit finance; and second,
central banks’ policies remain constant. In 1969, these assumptions
corresponded roughly to reality; by 2014, however, both had long ceased
to do so.
Figure 6 disaggregates America’s national debt into four categories of
ownership (directly-comparable data are available only for the years
since 2000). In 2000, private American entities (such as insurance
companies, investment funds, etc.) owned ca. one-quarter of all Treasury
securities. This percentage had fallen from more than one-half in 1969.
By 2014, this percentage fell further, to ca. one-fifth. Private
American investors, in other words, were once the U.S. Government’s
primary source of finance; but since at least 2000, they no longer do
so. The government’s deficits no longer “crowd out” private investors
because it now has other – and more significant – sources of finance.
Who are they? Foreigners – specifically, foreign central banks.
Figure 6
Who Owns the U.S. Government’s National Debt?
Major Components ($US Trillion), 2000-2014
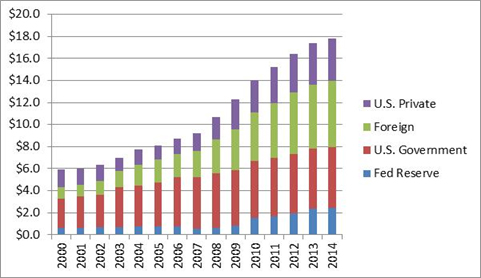
In 1969, foreigners owned a negligible percentage (less than 5%) and
amount ($6 billion) of Treasuries; of these, private (including
corporate) investors in Britain, Canada, France and Germany comprised
most of this amount. By 2000, foreign holdings had skyrocketed to ca. $1
trillion (15% of the total) and in 2014 to $6 trillion (33%).
Particularly noteworthy are China and Japan: in each country in
mid-2014, central banks owned ca. $1.4 trillion of Treasuries (relative
to their populations, South Korea and Taiwan are also big holders).
Why have foreigners, particularly the People’s Bank of China and the
Bank of Japan, become (apart from the Fed and U.S. Government) the
biggest holders of Treasuries? Asian central banks, using domestic
currency they’ve conjured out of thin air, have long purchased huge
amounts of $US. These transactions have decreased the demand for their
currencies relative to supply; they’ve also boosted demand for $US. As a
result, central banks have depressed these currencies’ rates of exchange
vis-à-vis the $US – and cheapened the price in $US of their exports to
the U.S. These central banks have then used significant quantities of
their vast $US reserves to buy Treasuries. These purchases, in turn,
have accommodated America’s skyrocketing budget deficits. Because
they’ve become the biggest buyers of Treasuries, Asian countries’ strong
demand has boosted Treasuries’ prices and thereby suppressed their
yields. Asian central banks have become and remain such eager purchasers
of Treasuries that the U.S. Treasury has been able to sell them under
increasingly advantageous (to the Treasury) terms and conditions. Yet
these terms and conditions also suit Asian central banks: since
Treasuries’ yields provide the benchmark for other rates, Asian central
banks’ voracious appetite for Treasuries has also suppressed the yields
of sovereign and corporate debt in China, Japan, Korea, Taiwan and
elsewhere.
Since 2007, foreigners and the Fed have comprised a strong majority –
ca. 70% – of the total; and of this total, moreover, foreigners have
demanded the lion’s share. Since 2007, in other words, the U.S.
Government has depended primarily upon the Fed and major foreign central
banks to finance its growing deficits. These central banks’ strong
demand for Treasuries has increased their prices and thereby suppressed
their yields.
What Have the Fed and Other Central Banks Wrought?
What happens if and when these central banks decide to decelerate
the rate at which they accumulate Treasuries – or even decrease their
holdings? Assuming that it continues to run big deficits, either the Fed
must buy (monetise) more debt or the U.S. Government must offer
significantly better terms and conditions – that is, materially higher
rates of interest – in order to entice other borrowers. What’s the
likelihood that China’s demand for U.S. Treasuries will abate? For a
decade, studies have found “evidence that some types of investment are
becoming excessive in China, particularly in inland provinces.” In these
regions, economic activity has become more dependent upon superabundant
and hence wasteful capital investment, whose object is the export of
consumer goods and whose impact is short-lived,
necessitating ever
higher levels of [wasteful] investment to maintain economic activity. By
contrast, private consumption has become more self-sustaining in coastal
provinces, in large part because investment here tends to benefit
household incomes more than corporates. … Thus, investment should not be
indiscriminately directed toward urbanization or industrialization of
Western regions but shifted toward sectors with greater and more lasting
spill-overs to household income and consumption. (Il
Houng Lee, Murtaza Syed and Liu Xueyan,
China’s Path to Consumer-Based Growth: Reorienting Investment and
Enhancing Efficiency, IMF Working Paper WP/13/83, March 2013.)
In short, if China’s economy successfully evolves from heavy
concentration upon capital investment and the export of goods towards
greater focus upon domestic consumption of goods and services, then its
dependence upon exports, the People’s Bank of China’s need to suppress
the currency’s rate of exchange – and thus the Bank’s need to buy U.S.
Treasuries – will all lessen. Perhaps something along these lines has
begun to occur: in November 2013, the PBC announced that it intends to
decelerate its accumulation of foreign currencies (including $US).
According to Seeking Alpha (People’s
Bank of China Announces End of U.S. Treasury Buying,
22 November 2013), its purchases of Treasuries will therefore slow.
Figure 7, which quantifies the rapid growth of the size as well as the
change of composition of the Fed’s balance sheet, summarises another
potential source of trouble. In particular, it shows the effects of
Quantitative Easing (QE) upon its balance sheet.
Figure 7
U.S. Federal Reserve’s Assets, Total and Composition
($US Trillion), 2003-2014
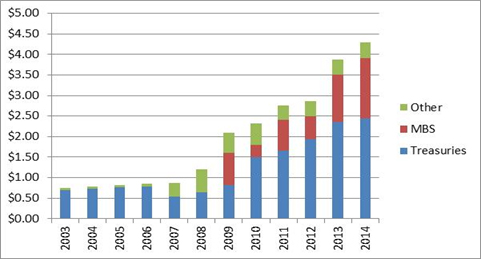
The Fed’s assets have grown from $870 billion in 2007 to $4.29 trillion
in mid-2014. That’s a compound rate of growth of 22% per year – much
faster than the national debt’s rate of growth, and even more rapid than
GDP’s. Before 2007, other assets (mostly foreign currencies the Fed buys
and sells in order to manipulate the price of the $US) comprised 10% or
less of total assets, and do so today. In 2007-2008, however, other
assets (purchased as part of the bailout of the mega-insurer AIG, etc.)
exploded to ca. $1 trillion and 40% of the balance sheet. Since then, as
these assets have been sold and unwound, the “other assets” category has
returned to ca. 10% of the total. Traditionally, and as late as 2006,
Treasuries comprised virtually all (90%) of the Fed’s assets. Since
2007, these assets zoomed five-fold (from $0.5 trillion in 2007 to $2.5
trillion in 2014). Yet their relative importance has diminished to ca.
60% of total assets in 2014. Why is this? It’s a result of the sudden
purchase of trillions of dollars of Mortgage Backed Securities (MBSs),
which in turn stems from the Fed’s policy of Quantitative Easing (QE).
To the extent that the central bank purchases securities that are
riskier than the government’s bonds, it also lowers those assets’
yields. If, for example, it purchases MBSs aggressively then it will
suppress their yields – and perhaps keep afloat mortgagees, or at least
the owners of the mortgages, who borrowed too much (and the banks that
lent too much). QE thus tends to boost the prices of certain financial
assets and to lower their yields, while simultaneously increasing the
monetary base in an attempt to spur much greater borrowing and lending.
What has QE wrought? The Fed now owns many of the “toxic assets” that
bankers created in 2003-2007. These assets’ losses (ca. $360 billion in
mid-2014) could conceivably reduce the value of the Fed’s assets below
the value of its liabilities, i.e., bankrupt the Fed. Under these
circumstances it “would need an injection of capital from the Treasury”
– that is, a bailout (see in particular Norbert Michel and Stephen
Moore,
Quantitative Easing, the Fed’s Balance Sheet and Central Bank Insolvency,
Heritage Foundation Backgrounder No. 2938, 14 August 2014). If
the Fed is potentially bankrupt and might require a bailout from the
Treasury (which is bankrupt in the sense that it cannot meet ca. $200
trillion of liabilities at 100 cents in the dollar as and when they fall
due), then, in effect, two bankrupts are underpinning the solvency of
the economy and financial markets. How “sustainable” is that?
Yet Janet Yellen, Ben Bernanke’s successor as the head of the FOMC,
isn’t merely unfazed: she’s upbeat. She “doesn’t see … the risk that the
extremely low rates [of recent years] could destabilise the financial
system” (Yellen
Sees Little Threat to Stability,
The Australian, 3 July 2014).
… Ms Yellen spoke one day after the Dow Jones industrial average set a
record for the stock market. Some critics of Fed policies have warned
that the central bank could be setting the stage for another dangerous
bubble by keeping rates so low for so long. But in her speech, Ms Yellen
said she didn’t see dangerous excesses in the financial system. She said
that there were “isolated areas of increased risk taking” but that those
could be dealt with through regulatory changes rather than by raising
rates.
Janet Yellen points to today’s tiny rates of interest as evidence that
the Fed’s “stimulus” since 2008 has succeeded. So does Ben Bernanke (Bernanke
Tells U.K.’s King: “We Saved Our Economies”,
MarketWatch, 29 December 2014). In sharp contrast, I regard them
as dangerous experiments whose consequences (namely reckless lending,
borrowing, investment and consumption) will cause havoc when rates
revert towards their long-term means. Easy money today merely defers
harder decisions to tomorrow. Am I crazy or is Janet? Am I too cautious
or is the mainstream too confident? Are the bulls right to boast that
rates won’t rise? Or, deep down, do they really fear that they
mustn’t rise because the consequences will be so dire?
An explosion of debt
Since the late 1970s in most Western countries, indebtedness (whether
corporate, household or government) has exploded. Yet because rates of
interest have cumulatively plunged, the burden of debt has eased. We can
summarise the era’s conventional wisdom: “Long-term saving and
entrepreneurship is for chumps; borrowing, speculation and get-rich
quick is for champs.” Events in 2007-2009 dented this alleged wisdom but
haven’t overturned it. The updated (post-2009) version might read: “In a
bull market, the way to wealth is debt. In a bear market, debt is the
way to oblivion; alas, the bear can arrive suddenly and seemingly (to
the crowd) without warning. Nobody can reliably ring a bell which
announces the end of the bull and the start of the bear.”
Debt is often called “leverage” because it magnifies financial results.
It facilitates the sale of businesses, cars, houses, etc., to buyers who
otherwise couldn’t afford them; it thereby makes the boom broader and
longer than it otherwise might be. But when the cycle turns the process
reverses. Marginal transactions, which debt financed, must be unwound
through foreclosure or bankruptcy; the prices of assets, which debt
boosted to unrealistic heights, must fall – and a chain reaction crimps
the prices of other assets. When over-extended borrowers reap the
whirlwind of what they’ve sown, debt proves to them, conclusively, that
they couldn’t afford these things after all.
Debt is thus the fair-weather friend par excellence. It’s your
best mate on the upside and your worst enemy on the way down. Ever more
experts and market participants are regarding the events of 2008-2009 as
an inexplicable aberration rather than the consequence of profligate
causes; hence they’re striking it from their memories. As they see it,
so long has the financial sun been shining that the skies will never
darken. But if you’re prepared to stand apart from the crowd and can
acknowledge at least the possibility of an extended spell of inclement
financial weather, it’ll behove you to reflect upon the indebted
American (and Australian, British, Canadian, Chinese, European,
Japanese, etc.) condition, and to consider the likelihood that one day
debt – and the central banks that have spawned it – may become just as
reviled as it’s now revered.
I’ve long pondered how investors might avoid – and even profit from –
this course of events. Not only does the severe recession, vicious bear
market and precipitous increase of rates that occurred during the 1970s
figure heavily in my thoughts: so too does a specific event that
occurred in Stockholm little more than 40 years ago. On 9 October of
1974, the Bank of Sweden Prize in Economic Science in Memory of Alfred
Nobel (commonly and falsely known as “the Nobel Prize in Economics”) was
co-awarded to a scholar who believed that the prize shouldn’t exist.
In his acceptance speech on 11 December, the Austrian-born and Austrian
School economist, Friedrich Hayek (1899-1992), noted that regarding
economics as a science fuels “the pretence of knowledge” – that is,
élites’ dangerous conceit that society is putty that they can mould into
a shape that conforms to their desires (and their models’ parameters).
Hayek, in contrast, contended that society is far more complex than we
realise, and certainly far more than a team of Ph.D.s with arcane
models, huge amounts of data and powerful computers can possibly manage.
Government interventions of recent years – ZIRP and QE are merely the
tip of a vast iceberg – indicate that our rulers really do believe,
despite common sense and recent experience, that they can plan and
manage the economy. Alternatively, perhaps they’ve become desperate
because they simply don’t know what else to do.
The elite’s ignorance-garbed-as-hubris backfires, always and usually
spectacularly, bringing in its wake what Hayek dubbed “unintended
consequences.” The unprecedentedly extreme policies hastily enacted to
extend the boom of 2003-2007 and to quell the crisis of 2007-2009 have,
I suspect, merely set the stage for and lit the fuse of yet another
crisis. When will it erupt? Alas, if only I could see the “foreseeable”
future! Were he here today, it’s unlikely that central bankers’
recklessness would either surprise or impress Hayek. “Instead of
furthering the inevitable liquidation of the maladjustments brought
about by the boom during the last three years,” he wrote in 1932,
all conceivable means have been used to prevent [the] readjustment from
taking place; and one of these means, which has been repeatedly tried
though without success, from the earliest to the most recent stages of
depression, has been this deliberate policy of credit expansion [and
suppression of interest rates]. … To combat the depression by a forced
credit expansion is to attempt to cure the evil by the very means which
brought it about; because we are suffering from a misdirection of
production, we want to create further misdirection – a procedure that
can only lead to a much more severe crisis as soon as the credit
expansion comes to an end (see the Preface to Hayek’s Triangles: Two
Essays on the Business Cycle, Laissez-Faire Books, 2013).
Little – least of all our rulers’ hubris – surprises Bill Bonner,
president of Agora Publishing and co-author of Empire of Debt: The
Rise of an Epic Financial Crisis (John Wiley & Sons, 2006). “The
Fed’s EZ money policies,” he says,
will either succeed or fail. Either
way, it will be a disaster. If they succeed, interest rates will rise …
and America’s debt-addicted economy will get the shakes. If they fail,
the Fed will double down with further acts of reckless improvisation –
including bigger doses of credit – until the whole thing blows up (Interest
Rates: Something Wicked This Way Comes,
The Daily
Reckoning,
9 July 2013).
Interventionists’ attempts to plan the economy centrally have repeatedly
failed dismally. Have we any reason to expect that “it’s different this
time” – that is, that ZIRP, QE and all the rest won’t, like all other
interventions, trigger unintended negative consequences (first economic
stagnation, finally financial crisis)? |
|
|
From the same author |
|
▪
Frank Knight's Economic and Social Theology
(no
326 – November 15, 2014)
▪
Austerity, What Austerity? Europe Desperately Needs
"Genuine Austerity"
(no
317 – December 15, 2013)
▪
The shameful treatment of Ron Paul by the mainstream
media
(no
300 – May 15, 2012)
▪
The Evil Princes of Martin
Place – Introduction
(no
286 – February 15, 2011)
▪
The return of Keynesianism
(no
278 – May 15, 2010)
▪
More...
|
 |
|
First written appearance of the
word 'liberty,' circa 2300 B.C. |
|
Le Québécois Libre
Promoting individual liberty, free markets and voluntary
cooperation since 1998.
|
|